
2014. 1. 8. 14:40
Create a Dynamic Pie Chart in SharePoint using JQuery & Google Chart API
1.Look at the below blog, to see the images of how to create standard view and insert new Web Part.
Create a Dynamic Column Chart in SharePoint using JQuery & Google Chart API
2. On the list, create new a standard view. Select the columns to you want your chart.
3. Click 'Site Actions' -> Select 'Edit Page' -> Click 'Add a Web Part' -> Check 'Content Editor Web Part' from Miscellaneous section and Press 'Add' button to insert the webpart.
4.Click edit -> select 'Modify Shared Web Part' -> Press 'Source Editor' button.
5.Apply the below code, that's it.
<script type="text/javascript">
if(typeof jQuery=="undefined"){
var jQPath="http://ajax.googleapis.com/ajax/libs/jquery/1.3.2/";
document.write("<script src='",jQPath,"jquery.js' type='text/javascript'><\/script>");
}
</script>
<script type="text/javascript" src="http://www.google.com/jsapi"></script>
<script type="text/javascript">
function drawVisualization()
{
var data = new google.visualization.DataTable();
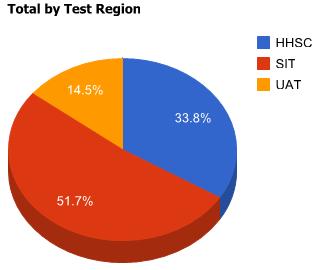
data.addColumn('string', 'Test Region');
data.addColumn('number', 'Total');
data.addRows(3);
data.setValue(0, 0, 'HHSC');
data.setValue(0, 1, 334);
data.setValue(1, 0, 'SIT');
data.setValue(1, 1, 510);
data.setValue(2, 0, 'UAT');
data.setValue(2, 1, 143);
new google.visualization.PieChart(document.getElementById('visualization')).
draw(data, {title:"Total by Test Region",'is3D':true});
}
google.setOnLoadCallback(drawVisualization);
</script>
<div id="visualization" style="width: 600px; height: 400px;"></div>
if(typeof jQuery=="undefined"){
var jQPath="http://ajax.googleapis.com/ajax/libs/jquery/1.3.2/";
document.write("<script src='",jQPath,"jquery.js' type='text/javascript'><\/script>");
}
</script>
<script type="text/javascript" src="http://www.google.com/jsapi"></script>
<script type="text/javascript">
function drawVisualization()
{
var data = new google.visualization.DataTable();
data.addColumn('string', 'Test Region');
data.addColumn('number', 'Total');
data.addRows(3);
data.setValue(0, 0, 'HHSC');
data.setValue(0, 1, 334);
data.setValue(1, 0, 'SIT');
data.setValue(1, 1, 510);
data.setValue(2, 0, 'UAT');
data.setValue(2, 1, 143);
new google.visualization.PieChart(document.getElementById('visualization')).
draw(data, {title:"Total by Test Region",'is3D':true});
}
google.setOnLoadCallback(drawVisualization);
</script>
<div id="visualization" style="width: 600px; height: 400px;"></div>
'메모' 카테고리의 다른 글
| Server.Execute (0) | 2014.01.20 |
|---|---|
| 말줄임표 (0) | 2014.01.20 |
| IIS Session Timeout vs ASP.NET Session Timeout (0) | 2014.01.06 |
| [MS-SQL] SET NOCOUNT ON eliminate @@ROWCOUNT values after table inserts? (0) | 2014.01.03 |
| [MS-SQL] Group By 없이 Count() 쓰기 (0) | 2013.12.30 |